Analytics - loyalty program
 Updated
A guide to interpreting your loyalty analytics
Practices can see ROI and visit data for their loyalty program through the Analytics tab.
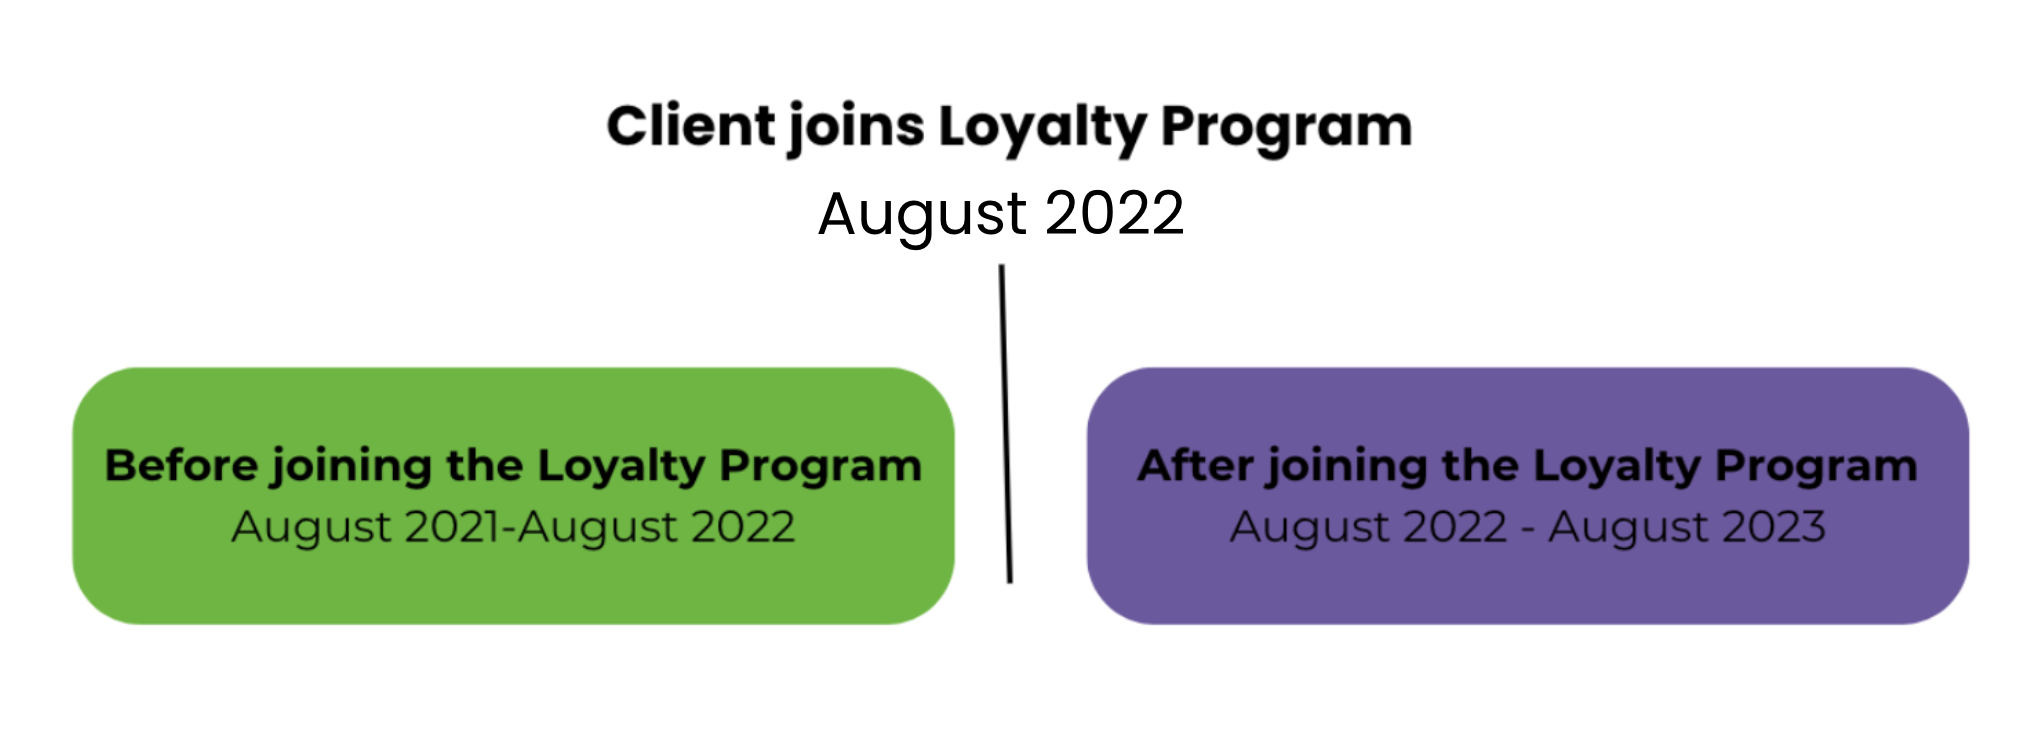
Loyalty analytics provide performance data for first-year loyalty program members. This is accomplished by measuring revenue and transaction data for one year before members joined the program and one year after members joined the program. For example, if a client joined the loyalty program in August 2022, behavior from the following date ranges will be compared:
There are several reasons you may not have access to loyalty analytics.
- There weren't enough new loyalty members in 2021 for a sufficient sample. We consider 100 loyalty members the minimum number.
- There weren't enough rewarded members in 2021 for a sufficient sample. We consider 20 rewarded loyalty members the minimum number.
- You didn’t have an active connection with your practice management software during the full period (Jan 2020 through Dec 2021).
- Your success coach has not enabled this feature for you yet.
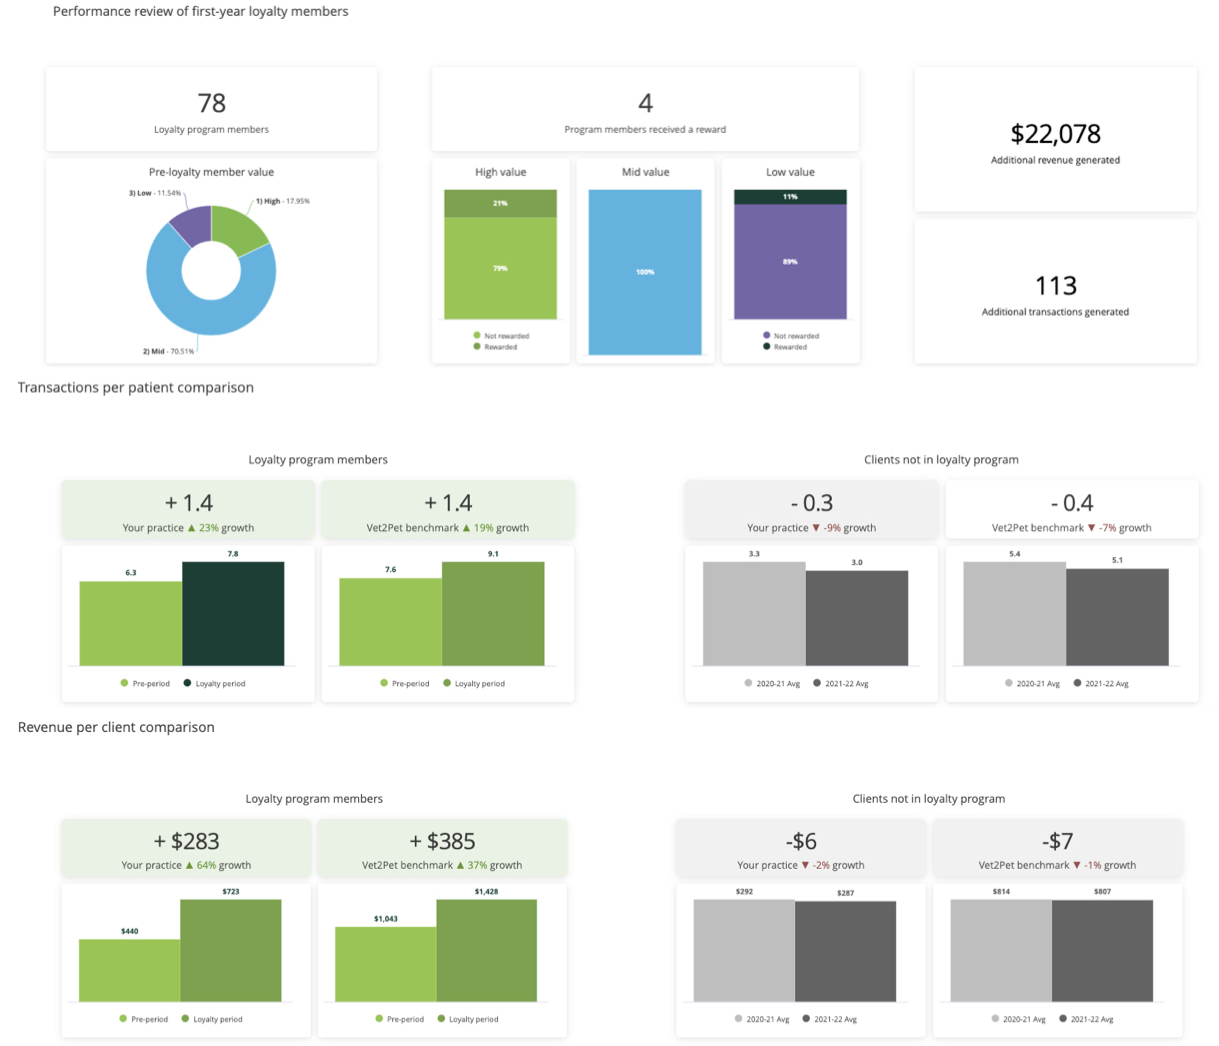
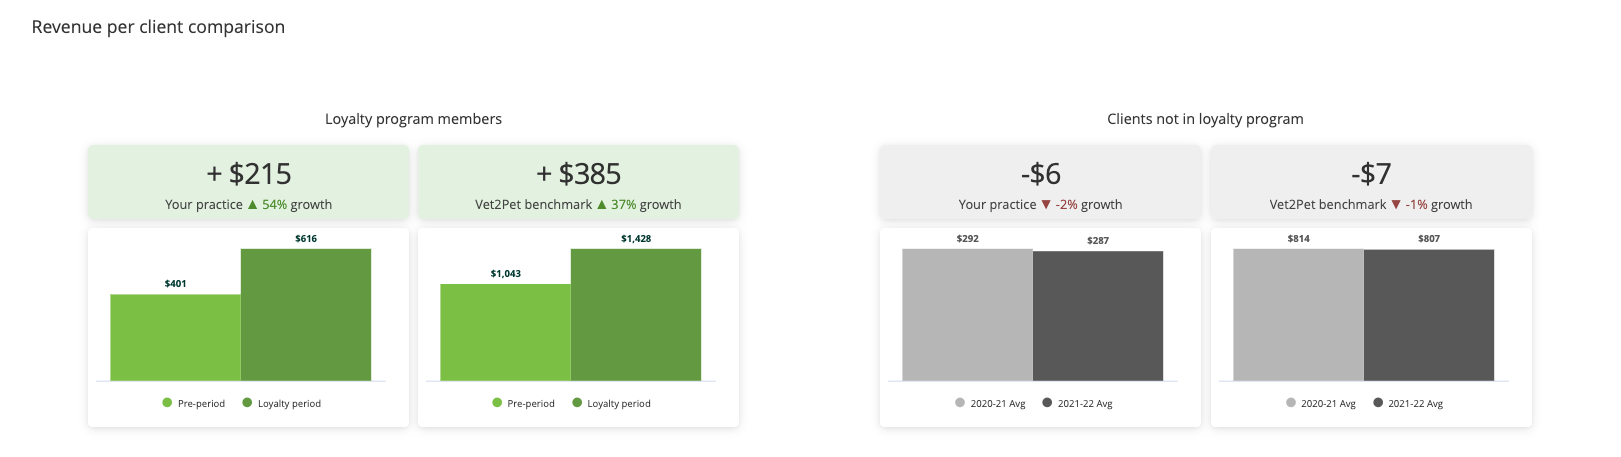
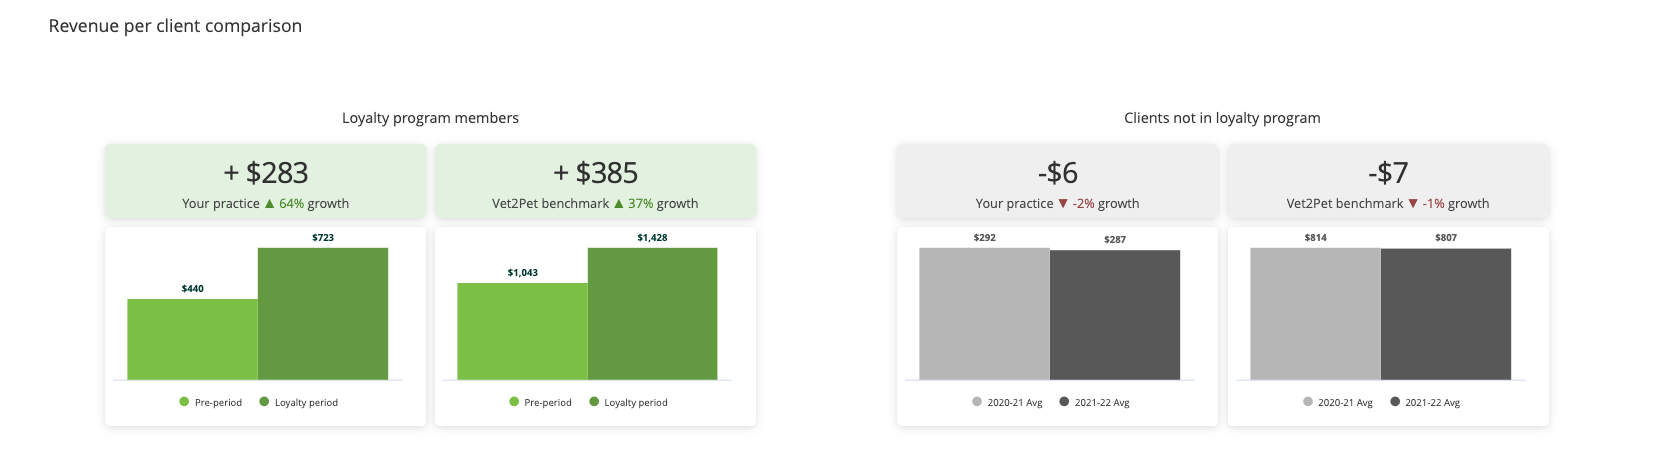
Step 1: Evaluate the revenue per client number and visit number for the rewarded members
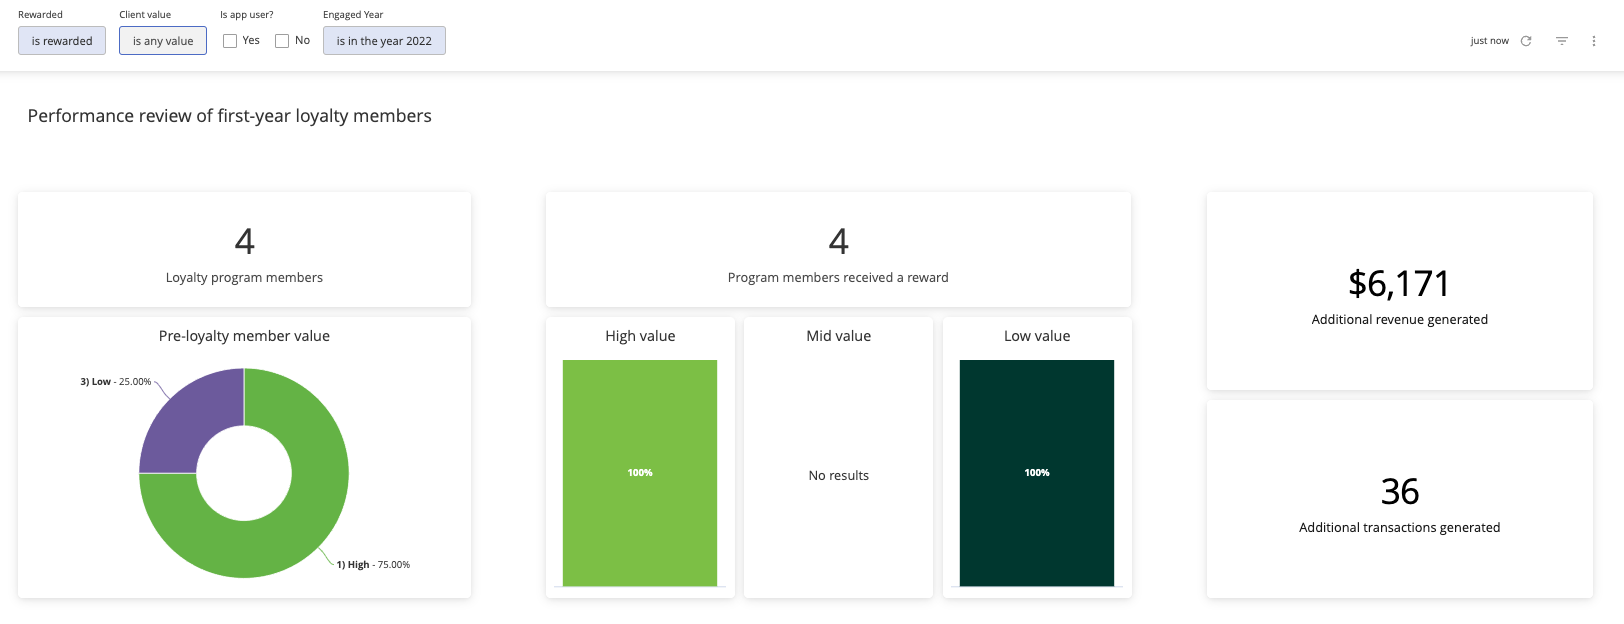
Filters needed:
- Rewarded: “is rewarded”
- Client value: “is any value”
Compare the revenue per client number for your rewarded members to the benchmark for all Vet2Pet practices. Are you outperforming the benchmark or underperforming?
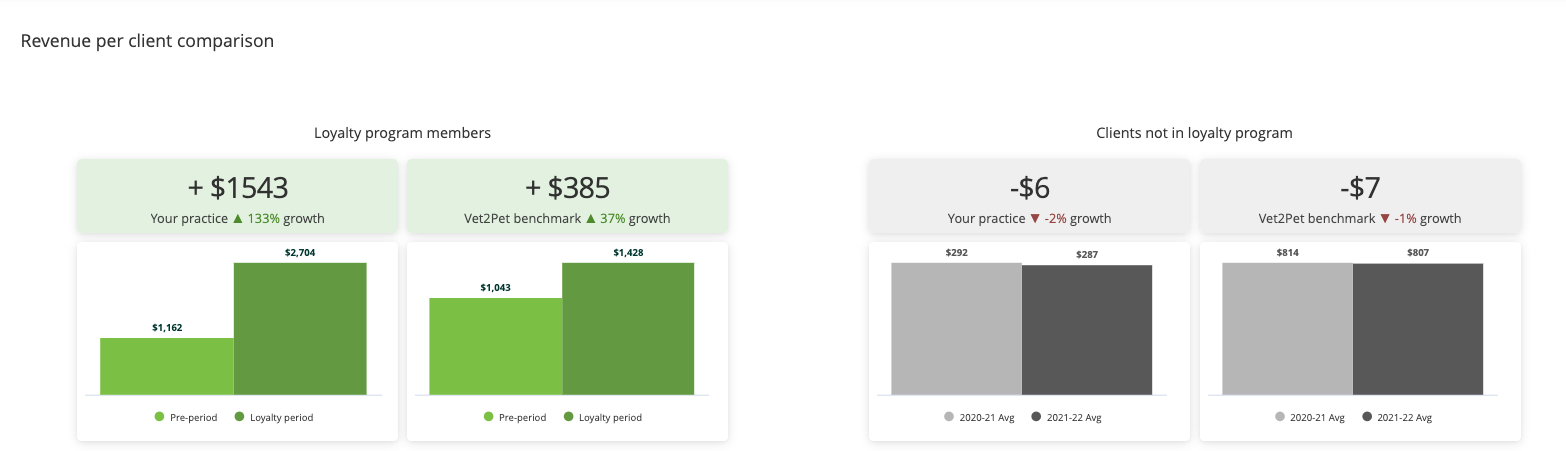
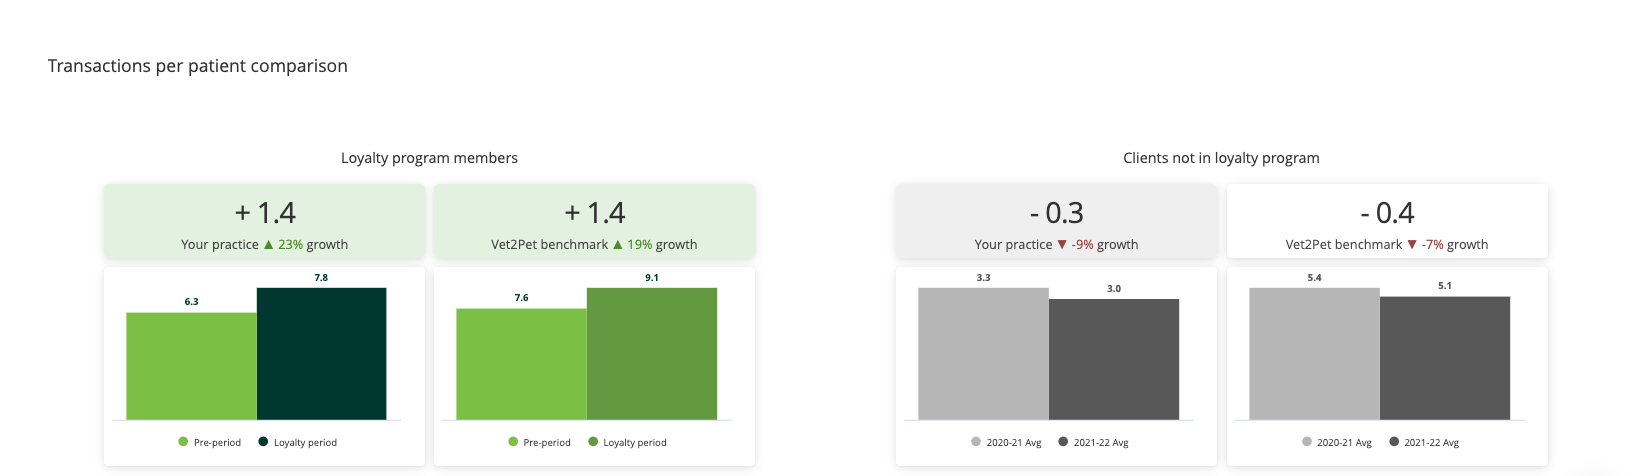
Compare the transaction per patient number for your rewarded members to the benchmark for all Vet2Pet practices. Are you outperforming the benchmark or underperforming?
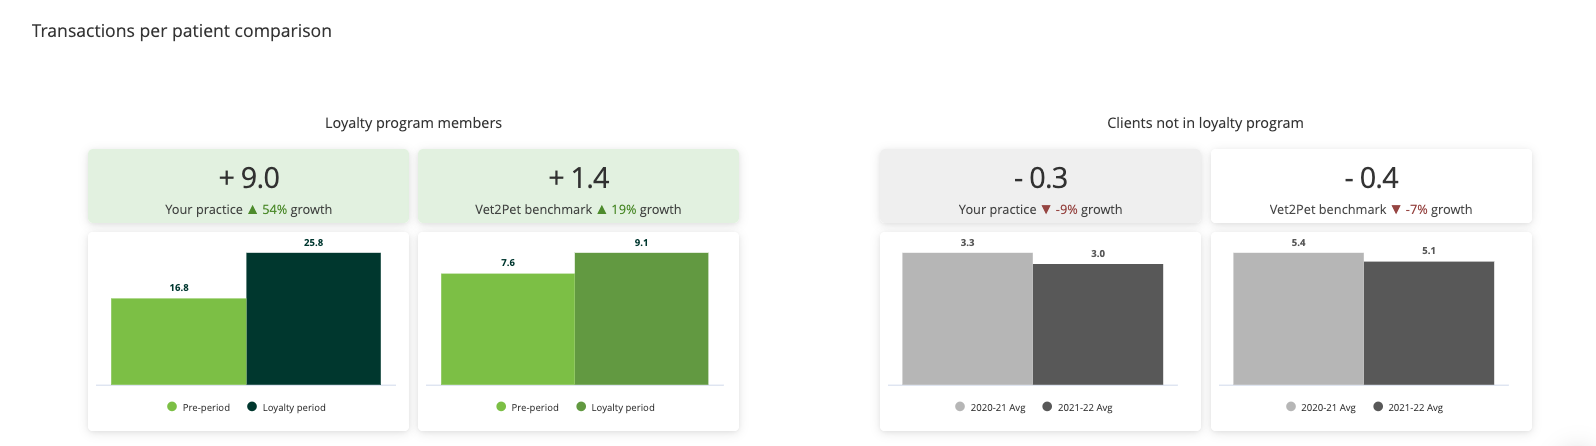
Step 2: Evaluate the revenue per client number and transaction per patient number for the non-rewarded members
Filters needed:
- Rewarded: “is not rewarded”
- Client value: “is any value”
Compare the revenue per client number for your non-rewarded members to the benchmark for all Vet2Pet practices. Are you outperforming the benchmark or underperforming?
Compare the transaction per patient number for your rewarded members to the benchmark for all Vet2Pet practices. Are you outperforming the benchmark or underperforming?
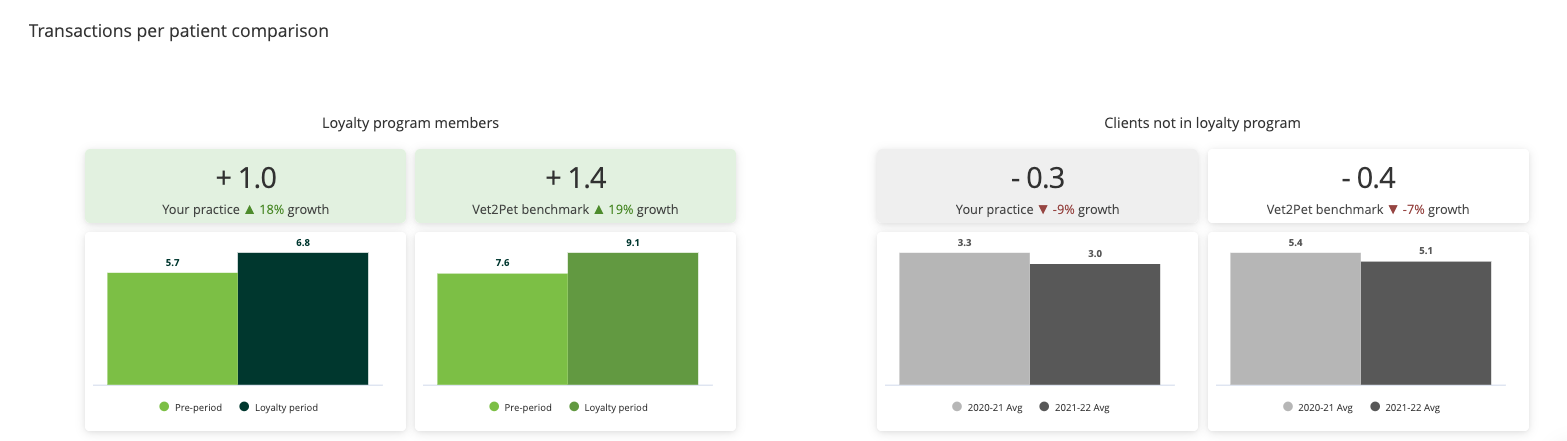
Data interpretation:
If you are underperforming, consider reviewing your loyalty stamps and rewards with your Success Coach. We have a tried and true program. The benchmark is the average for all loyalty members in over 500 practices using the Vet2Pet Loyalty Program. Reasons you may be underperforming:
- Your reward is too hard to achieve.
- Your reward is not desirable.
- The program is too complicated so clients don’t know what they need to do.
- Your front desk isn’t talking to the clients about the program at the checkout.
- You are granting stamps and rewards but the client doesn’t know about it.
- You need to market your program more.
Step 3: Compare non-loyalty members to the benchmark
Filters needed: "is any value"
Revenue per client
Transactions per patient
Data interpretation:
If your non-member revenue per client number is less than the benchmark, this suggests your practice is experiencing declining revenue across the board.
If your non-member visits per client number is less than the benchmark, this suggests that your visits/client is declining across the board.
Reasons for decline may be:
- Schedule not operating at full capacity
- Not accepting new clients
- Clients have left the practice
- Decline in pharmacy refill revenue
- Decline in nutrition sales
- You have not done a fee increase in the last 2 years
If your non-member revenue per client number is more than the benchmark, this suggests your practice is experiencing increasing revenue across the board.
If your non-member transaction per patient number is more than the benchmark, this suggests that your transactions/patient is declining across the board.
Reasons for this may include:
- Increased your appointment capacity
- Expanded services
- Increased pharmaceutical refills
- Increased nutrition sales
- Implemented a fee increase in the last 2 years
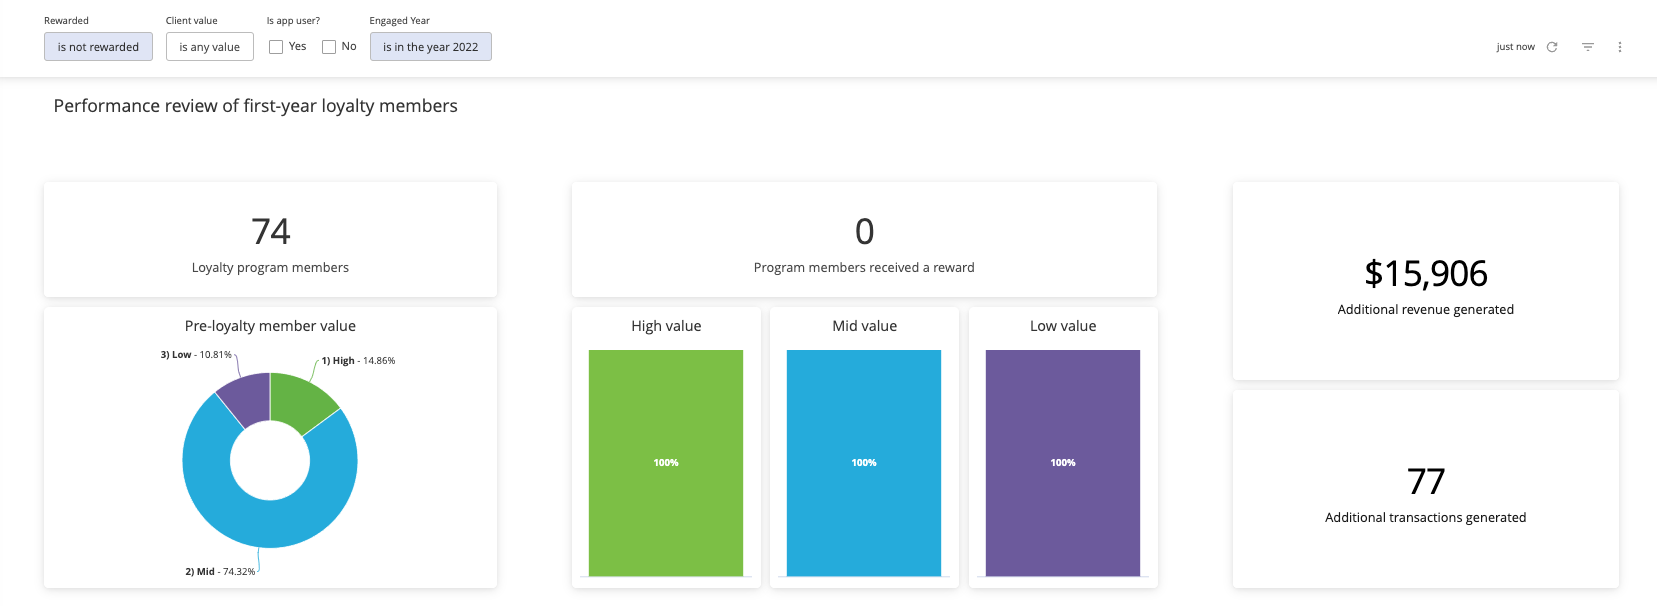
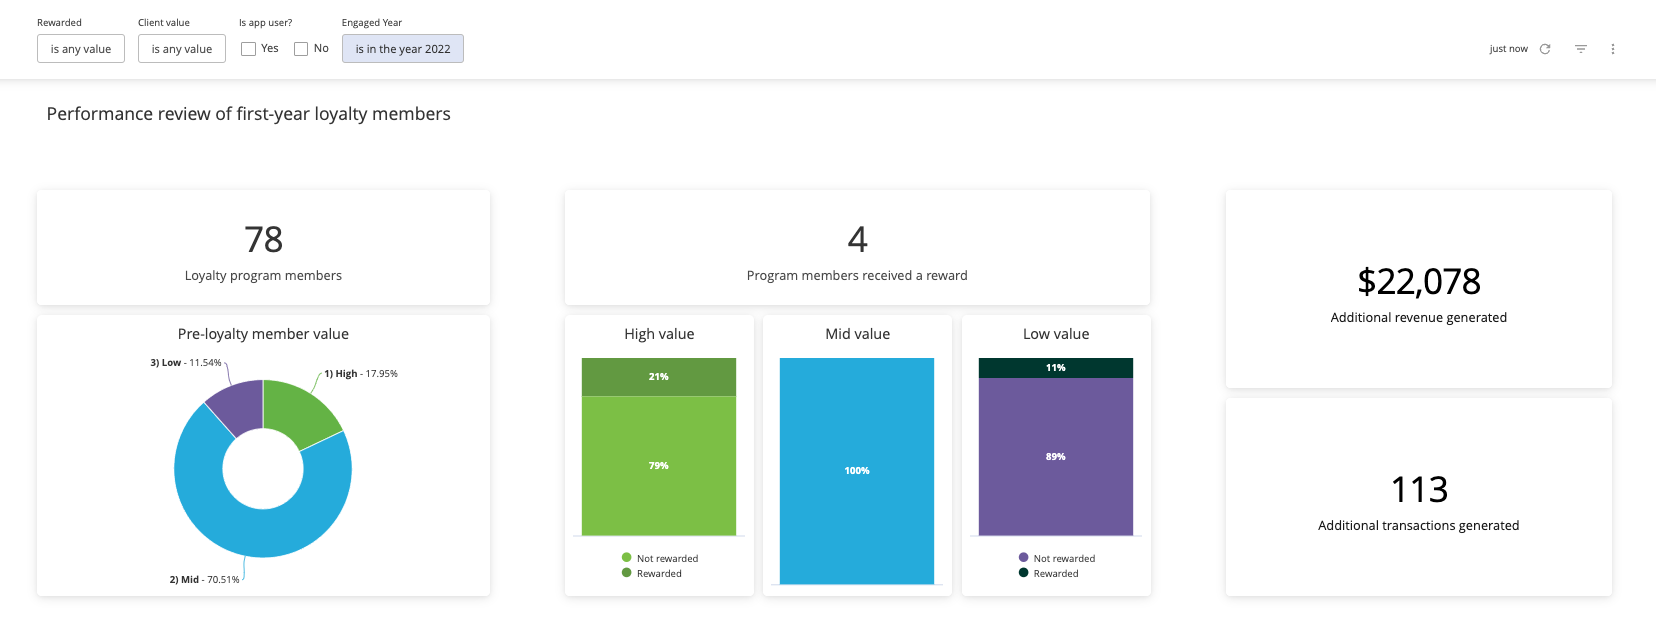
Step 4: Digging into high, mid and low value clients
When clients become members of the loyalty program, we bucket them into one of the following categories:
- High value
- Mid value
- Low value
We use an equally weighted combination of average revenue per client, most recent last visit, and number of individual line items in the client's invoiced record. This helps us consider more than just revenue with thinking about the most valuable clients in the practice.
In order to understand what is happening on the drilled down level, click on each value to view the data for the specific client value group. To further understand what is happening, view the value group as “rewarded” and then as “not yet rewarded”. The expected result is that the rewarded groups, especially high and mid value, are outpacing the average revenue and visits. It is most likely to discover that the low value clients aren’t moving the needle much for either revenue or visits. We also suspect that a low value rewarded client most likely experienced a serious issue with their pet in the loyalty period and they most likely would have “done it anyway”.
If you are seeing high value rewarded clients spend less in the rewarded period compared to the pre-period, first have a look at the high value non-rewarded clients. It could be that the high value clients are shrinking across the board. If you are seeing rewarded high value clients as a major revenue loss, it is important to take a close look at how your program is being executed by the team and clients are aware they are in a loyalty program.